A Hidden Benefit of 360-Degree Reviews

Ever wondered if there’s more to 360-degree reviews than meets the eye? In this article, we’ll uncover yet another A360 secret that could transform your team’s dynamics. We’ll explore real-life examples and offer practical insights that may change the way you view feedback and leadership development.
In Part 1, I outlined the benefits of 360-degree reviews and then illustrated them in Part 2 with a real-life example of an individual feedback profile analysis. In this Part 3 of the article, I will introduce you to yet another hidden benefit of A360 and demonstrate it once more with a real-life example. If you are considering introducing 360-degree feedback at your organization but hear opposing opinions, you may want to read this to the end.
The 360-degree review is a valuable tool when used for assessing and developing leadership potential, rather than as an individual performance assessment tool. However, there’s more to it than meets the eye. The most significant return on your time investment in A360 (as it is known among my clients) is realized when you conduct the assessment for your entire management team.
Another Real-Life Team Example of 360-Degree Review Data
Let’s take another real-life team example and explore the benefits of A360 on the team level.
The tables used in this article originate from a real client, with the names modified to ensure confidentiality.
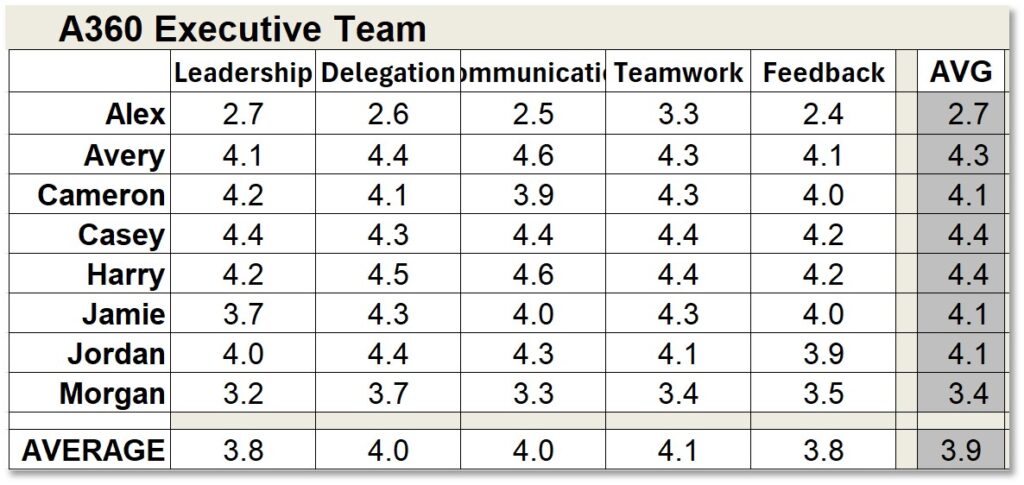
When the A360 data is collected and organized properly, you can generate an additional summary – on the team level. Now, all your managers’ data are organized in rows (Fig.1, click on the image to expand).
The data in the Executive Team Summary is subdivided as follows:
- Each row displays the individual 360-degree average ratings of one executive.
- Each column presents category ratings aggregated for Leadership, Delegation, Communication, Teamwork, and Feedback.
- Total/average ratings are provided per category and per person.
- The CEO’s ratings (from subordinates only, by definition) are also included in the table.
In most cases, your focus should remain on the aggregated category level. Delving into the individual questions, as we did in the case of individual assessments, is only warranted if you notice an anomaly in the individual ratings.
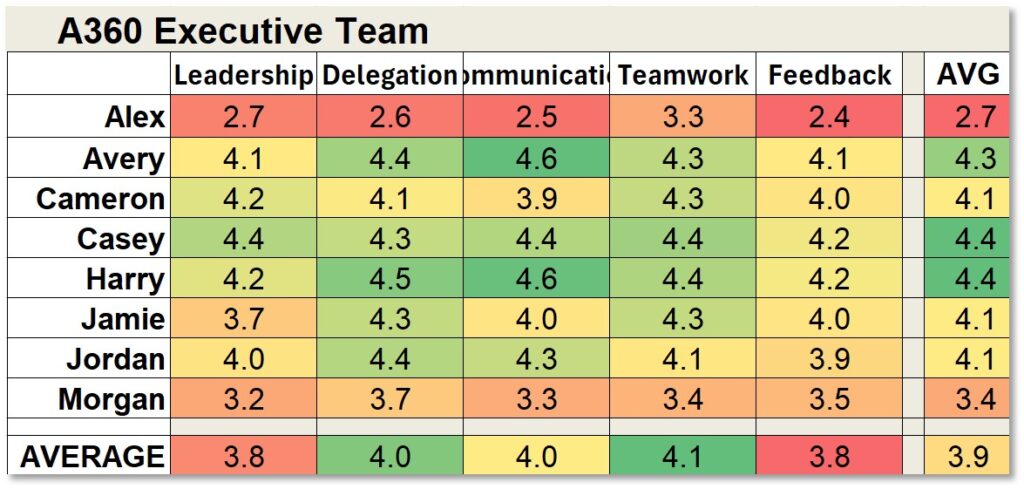
So, what do we observe in the data? Let’s apply conditional formatting (colour gradient across the entire table) to your Executive Team A360 summary table (Fig.2, click on the image to expand).
If your team is “normal” – i.e., reasonably functional and does not include any rogue individuals, you will notice your entire table “painted” harmoniously, without unexpected colour changes. This effect will be even more pronounced if your team is really good.
This is not always the case in real life. There can be various reasons, but more often than not, you may encounter a “spoiled apple” on the team. In our case, we observe at least one individual suspiciously “red.” The A360 helps you identify such individuals right away.
Team-Level Analysis
In the team-level A360, like in the individual A360 review, you search for the best, the worst, and the most varying ratings. For instance, Casey and Harry, closely followed by Avery, emerge as the obvious leaders, while Alex, closely followed by Morgan, appears to have a negative influence on the executive team.
It’s essential to note that at the team level, these ratings are averaged 360-degree ratings. Hence they are not skewed by any individual incompatibilities caused by random interpersonal misalignments.
Before implementing the A360, the CEO assessed his executive team as “OK.” However, upon analyzing the data, he was surprised to acknowledge that some, if not all, executive team members have areas for improvement.
This A360 Summary not only indicates the leaders and the ‘anti-leaders’ but also provides another valuable piece of information. It appears that in the overall executive team rating, the two categories, Feedback and Leadership, score the lowest (Fig.3).
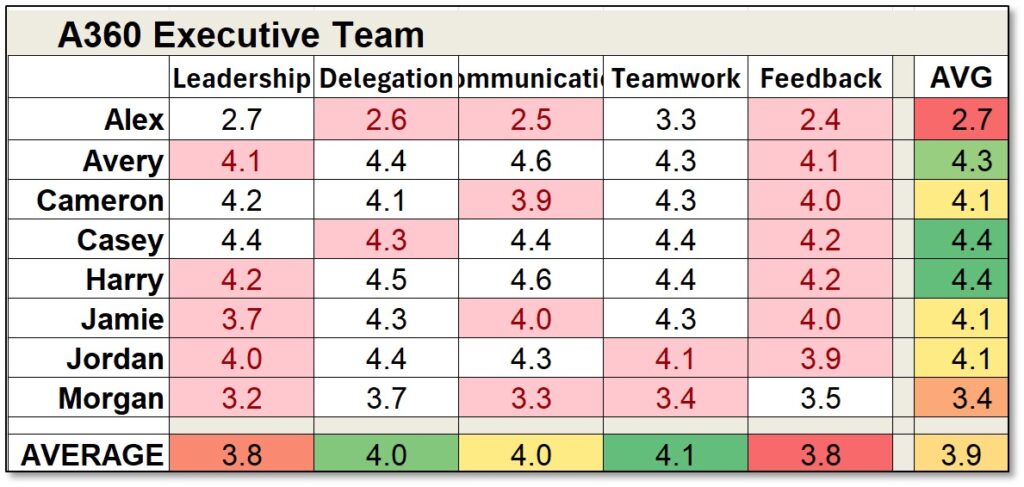
That revelation came as a surprise to the CEO and the entire team. However, in general, the lack of constructive feedback is one of the issues severely limiting the performance of many teams. Therefore, focusing on improving just this one skill and coaching the leaders to provide constructive criticism in a helpful and respectful manner will likely give a significant boost to the team’s effectiveness. If executed effectively, significant improvements should become evident within a matter of weeks.
Although this team-level summary is usually made available only to the CEO, the CEO may decide to share it with Alex and Morgan during their one-on-one meetings – if they have these conversations at all and unless, of course, Alex is the CEO. If the latter is true, the survey gives a good hint to the leader that there might be some areas for improvement for him, not for the team. Because it always starts with the leader, and there’s no reason for this team to be an exception.
Could We Have Detected This Deficiency Sooner?
While A360 review measures individual capabilities of managers, that define their leadership performance, and as we have just learned, indicates the executive team’s effectiveness, as well as the ways to improve it, here’s another interesting observation.
A360 offers the advantage of hindsight. But what’s the benefit? Isn’t it too late and too costly to replace a team member without affecting the ongoing projects, so what’s the use of this assessment? Sure, we can review our Summary table and acknowledge that certain team members may not possess the managerial skills we had anticipated. Thanks to A360, we now have “scientific proof” of their inadequacies in this area, but it must be unwise to invest additional resources in training them further. And we all are just too busy to find an extra minute for training or coaching.
The question remains: How could we have detected this deficiency sooner?
As a matter of fact, we could! Note that even though A360 gathers feedback from multiple colleagues through 360-degree assessments, it remains a subjective evaluation of an individual by their extended team. Experience shows that managers who are better aligned with their teams get better ratings, including the A360 feedback. Thus, if we had the alignment of the given manager with the respective team measured beforehand, we could have been less embarrassed with our team results.
Because team alignment is highly correlated with the person’s perception by other team members. Let’s take the same team and combine the A360 results with our Collectiver Q7 (Culture Compass) assessment. This is what I would normally do with my clients. Here’s how the results look side by side (Fig.4).
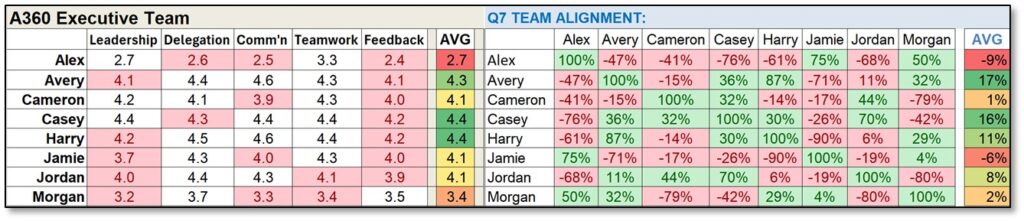
Just a glance at the merged data makes it clear that – surprise! – our anti-leader of the A360, Alex, is the least compatible person on the team as measured by Q7, while Casey, Harry and Avery are all “green” again. Coincidence? Not exactly. If we compare the two averages (AVG A360 and AVG Q7, Fig.5), the typical correlation between them is about 75% – which is not bad for the Q7 tool that is quicker to administer than a COVID rapid test and significantly less inconvenient.
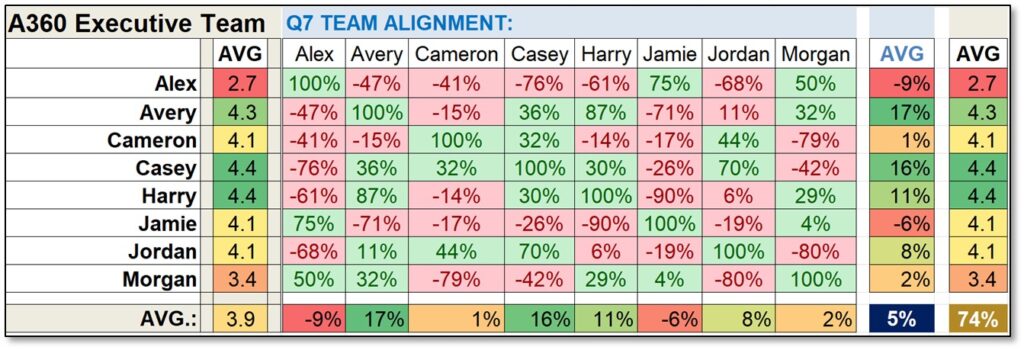
By the way, the Q7 Culture Compass measures the overall team alignment score. In the case of our sample team, it is only 5% (as you can see in the image above). Needn’t explain that this is very low. Decently functional teams have at least 15-20% alignment.
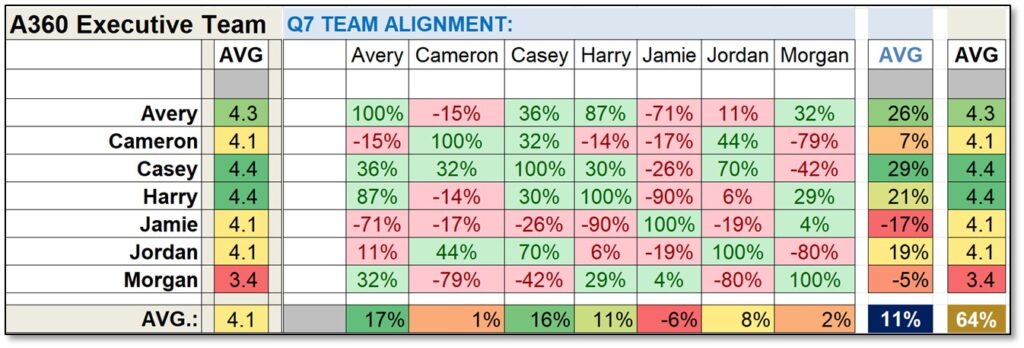
But watch: we remove the obvious culprit – Alex. Right away, we are at 11% of alignment, with A360=4.1 (Fig.6).
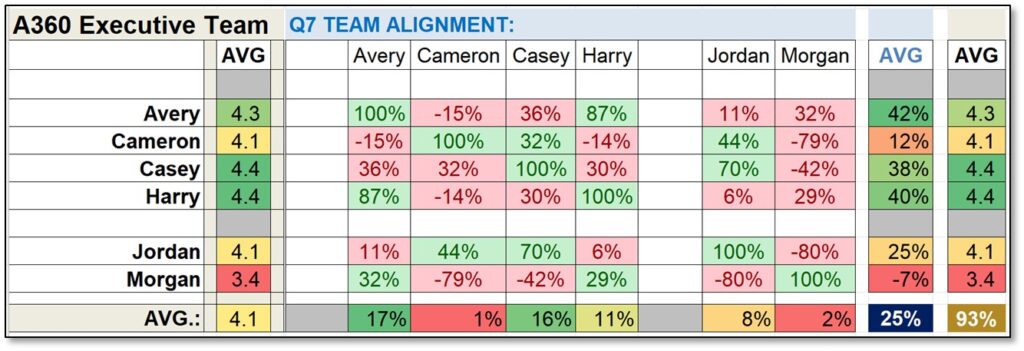
Remove the next candidate to let go as per A360 – Morgan, and we have A360 at 4.2, with Q7 alignment at 20%, which is not bad (Fig.7).
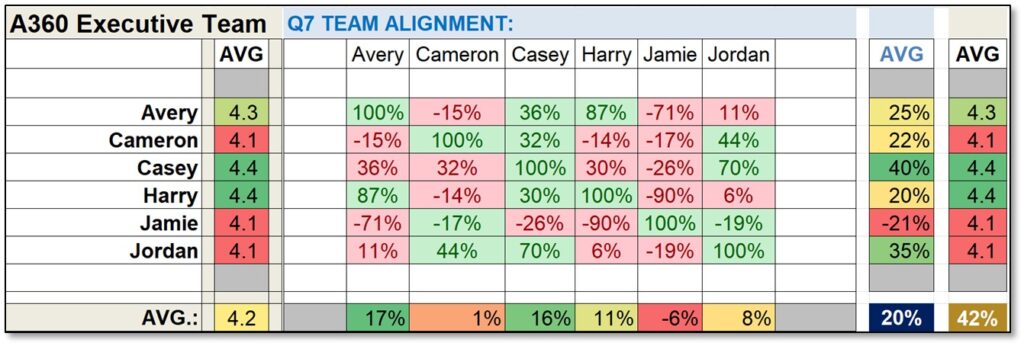
Or listen to what the Q7 suggests and take another route: remove the least compatible Jamie instead: you are at 25% right away, with the average A360 rating at 4.1( (Fig.8).
Reducing the already limited dataset further is not conducive to sound research practices. But although our dataset is becoming too small to be statistically significant, team alignment becomes crucially important when the team is small, close to the optimal “two-pizza” size.
It’s worth noting that while ensuring cultural compatibility can enhance the likelihood of positive 360-degree feedback and overall management effectiveness, the reverse is not necessarily true. Improving individual management skills alone may have a limited impact on team functionality if there is a lack of cultural alignment. Consistent low 360-degree feedback scores may indicate that a person, especially in a management role, is not a good fit for a particular team’s culture. If this is the case, the cultural misalignment cannot be readily resolved through a personal improvement effort. Cultural compatibility is a foundational requirement for effective team dynamics and management success. Without it, efforts to enhance individual management capabilities will likely yield suboptimal results.
The most important bottom line: select new leaders for cultural compatibility, and unless there are personal conflicting idiosyncrasies, management skills can be developed. While it may sound counterintuitive to some HR specialists, selecting a culturally congruent team can actually foster genuine diversity and unlock its associated benefits.
Key Takeaways
Of course, in real life, you do not remove managers that easily and you may need to replace them right away. However, with the Q7 assessment, this replacement becomes more focused and effective because you replace them with people who appear to be better aligned with the existing team.
Even with A360+Q7, this remains a delicate exercise. It is not a simple cut-and-paste action guided by an algorithm. Sometimes, it takes more than math or even AI to select the most congruent candidate. Note that certain individuals can act as connecting bridges between otherwise misaligned team members. Delving into this topic here may stray too far from the scope of this article, but it’s essential to understand that focusing on team alignment saves money. Neglecting it initially can lead to hefty costs associated with replacing a manager, possibly equaling up to two annual salaries.
1: Team-level A360 assessments reveal hidden strengths and areas for improvement on the team level.
2: A low individual A360 score is an indication of limited management skills; it is also likely an indicator of a poor fit with the team.
3: Combining the A360 assessment with the Q7 Culture Compass, offers deeper insights into team dynamics and selection.
4. Select new leaders based on cultural compatibility, as management skills can be developed through training, whereas cultural fit cannot be easily achieved.
By examining A360 feedback data alongside Q7 cultural alignment, leaders can make more informed decisions about team composition and development strategies.
To learn more about A360, Q7 and other business performance improvement tools, go to collectiver.com and look for Q7, A360 and “shared values.”